

Monday, November 1, 2010
Thursday, October 28, 2010

Tuesday, October 19, 2010

Wednesday, October 13, 2010
Updated Chart - Scenario 1 - Could the end of this up move be near!

If this is the end of the Wave 2, god help us all. I only wish we have a 5% pull back soon so that we do not just crash on this pathetic no volume and narrow rally.
Monday, September 6, 2010
Updated Chart - Scenario 1 is Revealing Itself

Looks like Scenario 1 from June 6th post is revealing itself. The concern I have is that if this scenario plays out the the ensuing drop will be even more dramatic than Scenario 2.
Remember this is Just One Man's Opinion!
Friday, July 16, 2010
THE PICTURE IS CLEARER

As "TIME" goes along the picture gets clearer. Are we about to witness a 3rd of a 3rd wave. If so I do not believe the world is ready for such an event.
I do believe "THE POINT OF RECOGNITION" has come but the question remains when will investors, speculators and governments decide to throw in the towel. The picture is telling us that the "TIME" is near and I am fear full for complacent individuals. An amazing investment opportunity is upon us over the next 3 to 6 years and one must not let fear get in its way when the worse is at hand. This outcome will not play out over night but will test the bulls and bears but ultimately we will find the terminal low where one can invest and hold for a 10 to 15 year period. This time should be a few years away but as the picture develops it maybe sooner than later.
"REMEMBER THIS IS JUST ONE MAN'S OPINION"
Friday, July 2, 2010

Sunday, June 20, 2010

Sunday, June 13, 2010

Sunday, June 6, 2010
POINT OF RECOGNITION COULD BE HERE OR NOT!
It is pretty much confirmed that the top on April 26th will be significant as we move forward.
I see two scenarios going forward. I first like to point out that we are in very volatile times and individuals who are in long only equity investments and do not have the ability to add additional funds over the next few years should consider changing their allocation to 80% short duration fixed income instruments and 20% dividend paying equities . Cash will be king over the the next 3 to 6 years however there will be an incredible opportunity to invest in undervalued companies with dividend yields of 6 to 10%. Complacency is not an option in this environment and this is why I am writing this blog to help people understand where the potential lies ahead.
The problems are fierce amongst this liquidity driven growth over the last 15 months which has been primarily driven be government spending. The only way we will get longterm growth is if the private sector has the confidence to hire again. The great reflation experiment by governments around the world are only buying time for the inevitable. There will be the day where we will all have too pay the piper but this experiment could possibly hold together longer than many believe. The statistics are overwhelming and I believe the issue going forward will be a sovereign debt funding crisis. The questions is when will we get to this point of recognition. I think we are starting to see some recognition over the last month but the ulitmate recognition could be a couple of years away for the USA. Since the USA debt is so large there will be a time where the usual buyers of the debt (China and Japan) decide they have enough and need no more. Since all countries are running a fiscal deficit we are going see a great competition to sell debt. If you really think about all we have done is use more debt to fix our problems but it was too much debt that that got us in this mess. It does not take a rocket scienctitst to see where this is all going to end up.
Scenario 1
As per my analysis the the April 26th high should hold this year and may only be surpassed early next year but it will only be a short lived sucker rally.
If we hold the 1000 level over the next couple of months and trade in wide range between 1160 and 1000 for the next 6 months we may see one last attempt for the April 26th high before the potentially very difficult years that will begin in late 2011 and continue for 2 to 4 years.

Scenario 2
If this is the start of Primary wave 3 which all likely hood it is we may have already completed the 1st and 2nd wave of primary 3. Therefore if the May 25th low is taken out we can potentially be in the midst of a 3rd of a 3rd wave much sooner than most people believed. If this is a the 3rd of the 3rd my first target area zone is 882 the second is 818.
If this scenario plays out it will exhibit crash type characteristics. If we see a close below 997 for 3 days there is the potential for a 20 to 30% drop in very short period of time.

In either case the risk reward to be invested in the stock market over the next few years is not attractive for any long term investors. Especially anyone with a 5 to 10 year time duration. For the younger individual this is an amazing time to periodically invest through this difficult period and average in as price declines knowing when we do get out of this difficulty the market will rebound significantly from the ultimate lows. Complacency is not an option for anyone in retirement or approaching retirement within the next 5 years. There is a great risk of capital loss just before retirement and there just won't be enough time to make back any significant losses back.
"Remember this is just One Man's Opinion"
Tuesday, June 1, 2010
EURO - MONTHLY CHART IS OUR GUIDE

I have been looking at this monthly chart for 6 months now and was forecasting 1.20 back in the fall of 2009. No we have hit this level thus going long might seem required at this moment. However the monthly chart is telling us the impeding weakness that is to come over the next 6 to 8 months. As we closed below the low of wave A 1.2327, the market is now telling us that further fib levels will be hit. When it comes to Elliot Wave the wave structure is the most important thus it is interesting to note that if the Euro continues as a common currency and when this C wave decline ends we may be witness to another leg higher in the euro within the next 2 to 3 years. It is hard to believe that at this moment but the wave structure on the monthly chart is telling us that we do have significant room to the downside but when this structure becomes terminal we could see a 3rd wave up on the monthly chart. I find looking at the weekly and monthly chart it gives you a great understanding of where price will ultimately go.
Thursday, May 27, 2010
S&P500 E-Mini - Hourly Chart - Channels and Fib levels

The "Channels" are our guide and but the FIB levels always come first.
Wednesday, May 26, 2010
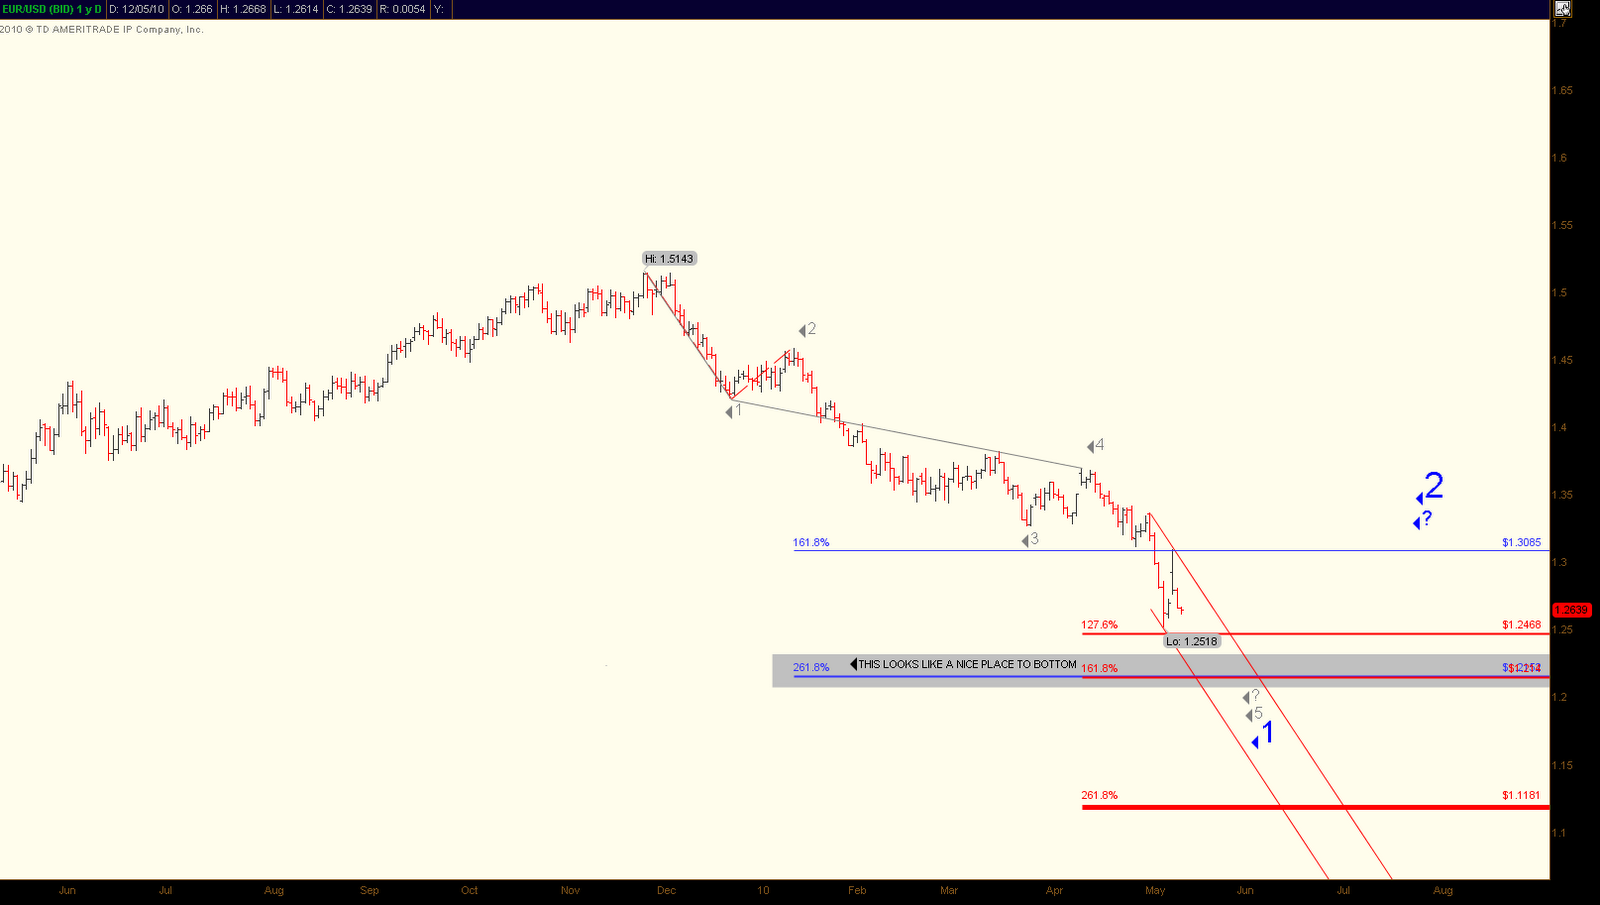
FISHING FOR ANOTHER BOTTOM IN THE EURO

The picture has now become clearer in the short term.
Key Pivot level is 1.214. If this level breaks we should have one more push down to the fib cluster between 1.1691 to 1.1898.
Long term targets are 1.1338, 1.0310 and .8988. Will provide a chart at later date.
"Remember this is just One Man's Opinion"
Tuesday, May 25, 2010

USDCHF - FIB ZONE HAS BEEN HIT

SELL ZONE HAS BEEN HIT
TARGETING 1.14 AND 1.12 AREA
"Remember this is just One Man's Opinion"
USDCAD - APPROACHING FIB RESISTANCE

LOOKING TO SHORT BETWEEN 1.0870 TO 1.093
TARGETING 1.0663 AND 1.0606
"Remember this is just One Man's Opinion"
Monday, May 24, 2010
The Markets have Showed their Hand
As per my previous post it looks like the market has taken the alternate count. However if we break the May 6th lows again, which may happen overnight, we will visit the 1000 to 1020 area in a swift and decisive manner. From that level as all round number tend to act as significant support or resistance. When price approaches we should see some kind of bounce. It is very much possible the travel to this level will be very complex and many head fakes on the way there. As I look at the real time chart as I write we are at midst of a break of the low from last Thursday. If this double bottom holds we should see a rally up to the 1110 to 1120 area. The market showed its predictive hand and it is not going to be for the faint of heart investing in equity, commodity and currency over the next 2 to 3 years. There will be great trading opportunities for the trader type mind however for the majority of the population cash will be king as we muddle through this most difficult period. There is nothing wrong in being in cash but the key to cash is that you have too be fearless when the opportunity presents itself. I believe we will be witnessing the ultimate bottom within the next 2 to 6 years, which will set the stage for another great bull market that should begin between 2018 and 2020 and last for 10 to 12 years.
"Remember this is just One Man's Opinion"
Wednesday, May 19, 2010
Since May 6th the market has demonstrated that the crash on that day was more than just a "fat finger". Like I said before, May 6th was an omen of things to come. We will see a few more of these crash like days over the next few years. No matter what governments do, inevitable price will continue where it wants to go. The market should trade in a choppy fashion over the next 2 to 4 weeks. We are in the midst of a wave 4 correction on the daily. My feeling is that this correction maybe more complex than most believe. Due to the fact that the wave 2 correction on the daily chart was very simple, thus wave 4 will trade in a frustrating pattern. It is possible that we trade one more time to the 1160 to 1170 area of the s&p500 to complete a 4th wave flat type correction. Any close on the weekly chart below 1080, the S&P500 will be visiting 1000 faster than anyone believes. The structure of the market is showing bearish implications, this 1st wave of Primary wave 3 is providing us a glimpse of what is to come over the next 2 to 3 years. After wave 1 of primary wave 3 is complete we may see one more rally to 1200 on the S&P500 just to suck everyone in for the biggest leg of this bear market and that is wave 3 of primary wave 3 or as most Elliotticians say the 3rd of 3rd wave. If wave 3s are never the shortest and usually the most dynamic; just imagine how dynamic and fast the 3rd of 3rd will be compared to this current structure. Any longterm investors should be in cash right now and wait for the buying opportunity of our lifetime within the next 4 years.


Tuesday, May 18, 2010

Friday, May 14, 2010

Wednesday, May 12, 2010


Tuesday, May 11, 2010
Monday, May 10, 2010
Where is all this Money going to come from?
Where is all this money going to come from? It looks like the next crises is going to be a funding crises. Debt ratios won’t matter anymore because there is just not enough money to go around fund all these bailouts. Eventually the investor in the debt will want more than just few % points and may decide we just have too much of all this debt that in the end will never be paid out. When are these governments going to learn that these Debt crises cannot be solved with more Debt. These bailouts in the end are only pushing the problem out to a later date. The market is bigger than any government thus these bailouts are not going to help the EURO and the overall market over the next few years because price is always goes where it wants to go. The really reason the market crashed last week is because it was “TIME” for the market to do down and “TIME” in the end is always the most important factor for market reversals. The end game is not pretty unless these governments are willing to let the free market decide what should happen. I do realize if they did nothing there would be a lot of pain but at least it would be done within couple years instead just hanging on for the inevitable.
"Remember this is just One Man's Opinion"
Sunday, May 9, 2010

Friday, May 7, 2010
IS THIS THE BIG ONE!
Wow! What a day yesterday and this will be one for the ages. We had a complete panic yesterday and in hindsight there were many clues telling us this was possible. Now the media is fumbling a long trying to explain why this happened. Can you believe they are blaming it on a fat finger. Someone just happened to pressed the billion share button instead of the million share button. I do not know who they are trying fool but unfortunately 95% of investors will believe this and continue not to recognize the significance of yesterdays market crash. It was not the fat finger but "TIME" that triggered this fall. It was the biggest one day drop ever and I still feel that there continues to be too much complacency even after such an event. Now we may get a snap back rally to 1160 on the S&P500 but I feel the market did give us a hint of what is to come. Over the weekend we should here central banks around the world talk about intervention and possible measure to stem further volatility. This may support the market over the next week but just like the 2008 meltdown the market is just too big for any central bank to stop price from going to where it wants going to go. The key level on the downside over the next few weeks is the 1070 level on the S&P500. If we break this level with momentum and close below the February low this could be the start of a wave down that will be larger than the 2008 wave down. The name of the game over the next few months will be volatility.

Below is my Master Weekly Chart for the S&P Emini.

"Remember this is just One Man's Opinion"
Wednesday, May 5, 2010
"TIME WAS UP" & "NOW WHAT"
As per the last blog entry the "Critical Juncture", it was "Time" for the market to correct. Now the big question; “is this the start of something bigger”? As per my previous chart all markets have reached their primary targets for a meaningful reversal. The first wave down is now complete and the ensuing retracemement will give us a hint of what to expect over the next few months. It is very much possibly that we may see one more high this year as long as we stay above the February lows. The current correction was impulsive in nature so we must all be aware that this could be the big one. What I mean by that is that we could be in the midst of the 3rd wave down. The 3rd wave is never the shortest and usually the largest and most dynamic wave. If this is the case we may see the market retrace the majority or more of the rise over the last 14months. My gut feel is that we correct over the next few months to setup a year end rally that may carry into the q1 of 2011, and rise either new highs or lower highs. Therefore setting up for a major correction in the next bear market cycle in 2011 to 2013.
Forecasting is not exact but I use it as tool to understand the primary trend. It is very important to understand that flexibility is paramount in forecasting market trends. The market trends could last a lot longer than anyone can imagine thus you must always be aware of the alternate scenario. That is why when I do provide my analysis it may look like I am contradicting myself but actually I am just protecting myself. I can always guarantee that the market is going up or down but determine the trend and knowing what the primary trend can save you a lot in the long run.

"Remember this is just One Man's Opinion"
Monday, May 3, 2010
Critical Juncture
The market place is at one of those junctures where time is now the most important indicator for all markets. As Gann says "TIME" is always the most important indicator to all others. Not an exact quote but ultimately that is what he meant. Stock Indexes have completed 99% of possible retracement of the bear market decline. Currencies are also at a specific juncture where we could see a temporary retracement of the primary trend of the US$. The US$ is in a powerful bull market that has surprised many people however many wave counters such as myself, new that an impeding reversal was about to come. Psychology on the US$ was at extreme bearishness in November and December of 2009, but now we see the opposite sentiment. Thus, over the next week or 2 we should see a temporary and short lived reversal of the US$ strength. Therefore Euro and Yen strength could emerge, since they make up a good % of the US% index. This strength will be temporary and may only last 2 to 4 weeks. The next leg up in the US$ will be significant and may drive the Euro down to 1.20 or lower.
I will be posting a few charts over the next day or 2 to show you what I am seeing.
S&P E-MINI WEEKLY CHART

GBPUSD

Remember this is just “One Man’s Opinion”
Saturday, April 17, 2010
Weekly Outlooks April 18th 2010
EURJPY
Could be in the midst of making a bottom based on recent price action however based on weekly Elliot wave count there is potential that wave 4 is complete and wave 5 is next to new lows.
Make or break right now is 121.055.
Buy dips into 61.8 and 82 weekly fib levels with a stop at 121.
Caution is noted because the daily trendline (TL) broke but the market did not close below TL.
Market may range between 123 and 127.
A close on the daily below 121 gives us first target level of wave 5 of 118.84.
A close above 128 exposes 132 and may attack 134.
Remember this is just “One Man’s Opinion”


Subscribe to:
Posts (Atom)